Reports and statistics#
Reports document work carried out. Statistics give insight into operations and maintenance. Together they are the route from history to insight.
Reports#
Work order reports can be filtered by:
- Work type
- Location
- Year, month or period
Reports can include photos, and are used for:
- Documentation — what was actually done
- Auditing — documented compliance at an inspection
- Customer follow-up — showing what has been delivered
A report is generated from a work order: open the work order in the side panel → the hamburger icon in the top right → Create report.
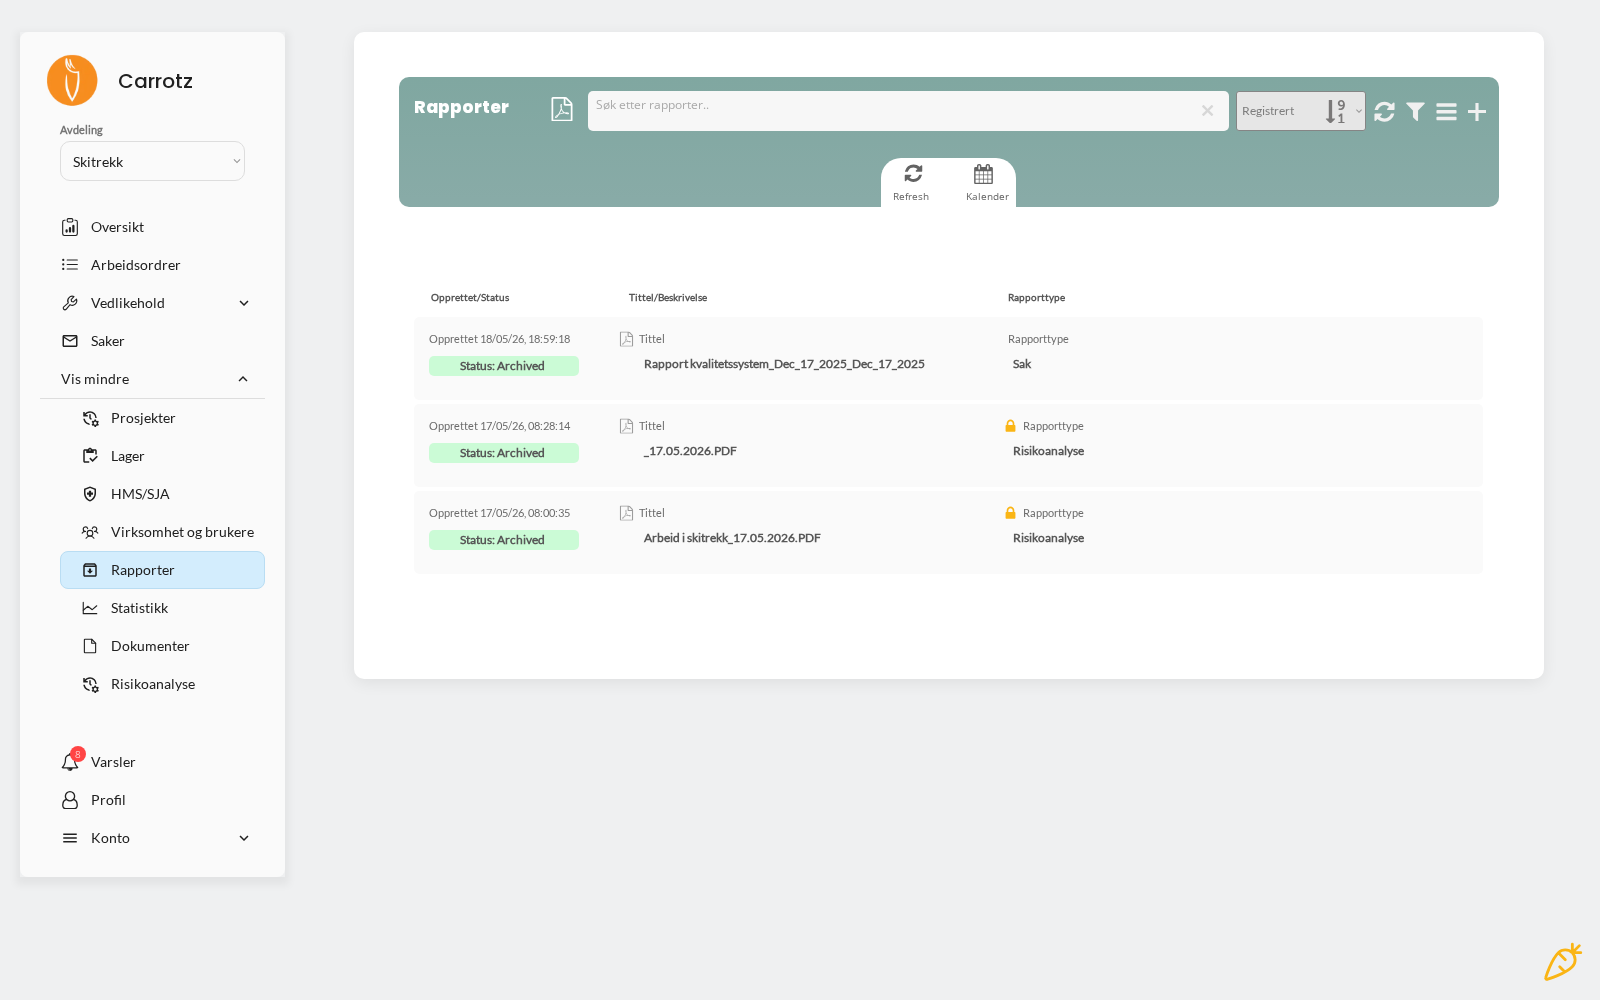
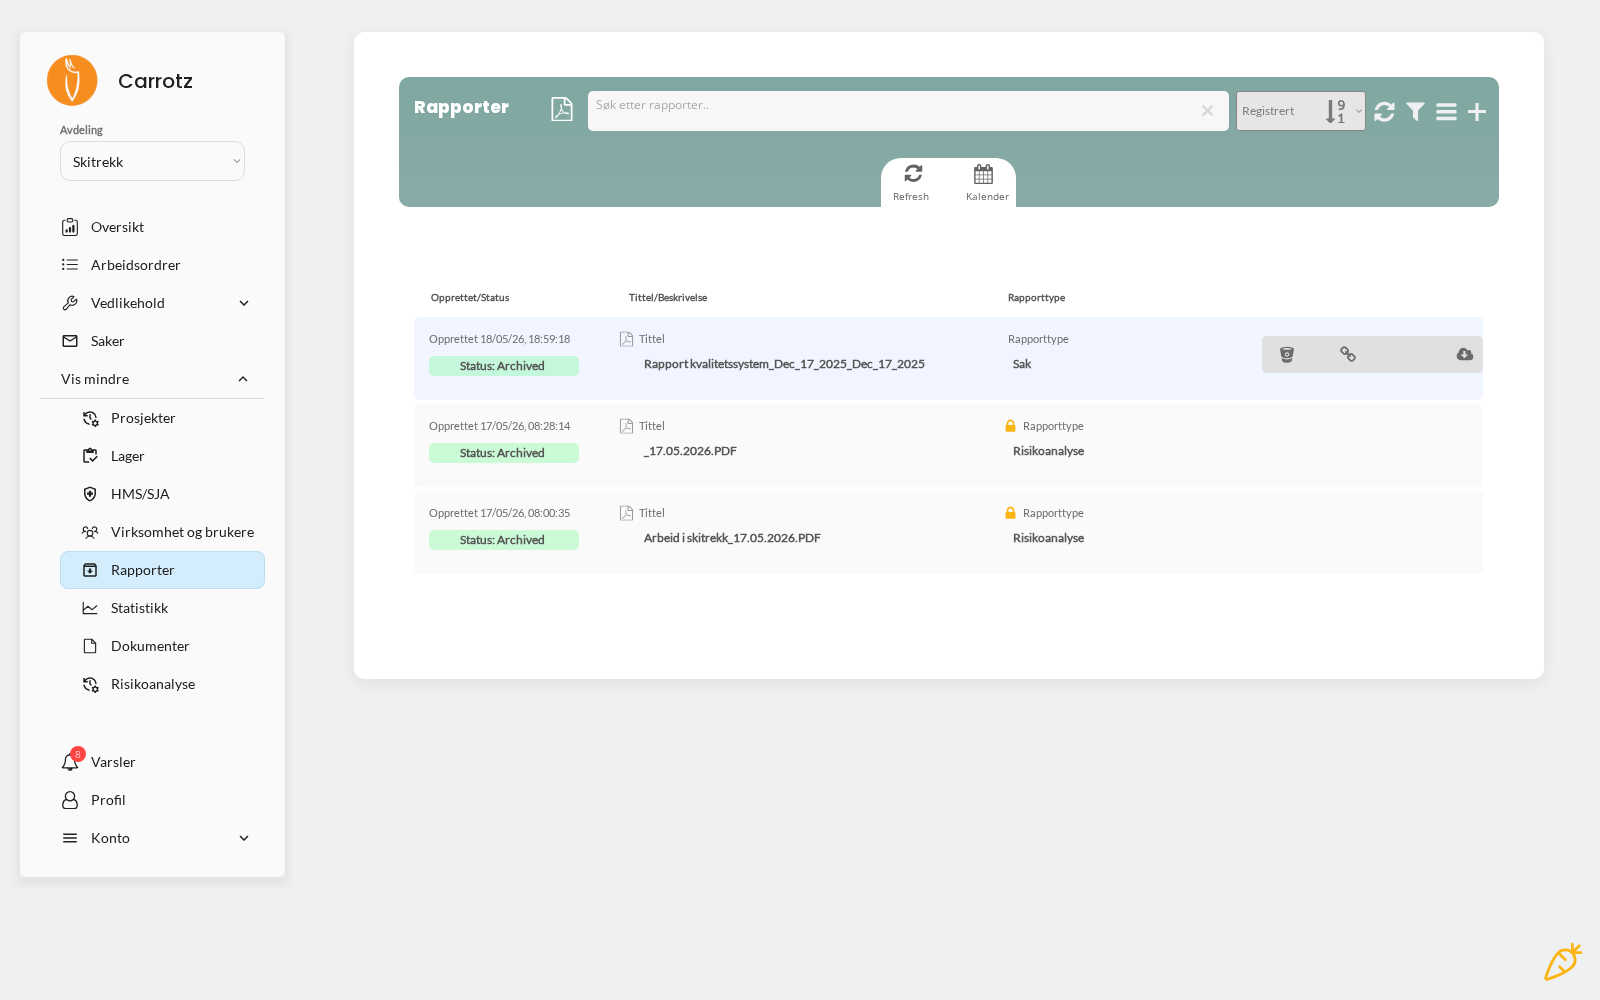
docs/static/img/admin/rapport-eksempel.pngPhotos in the report are often what makes the biggest impression at an inspection and in customer conversations. It is also the best reason to insist that field users photograph as they go.
Statistics#
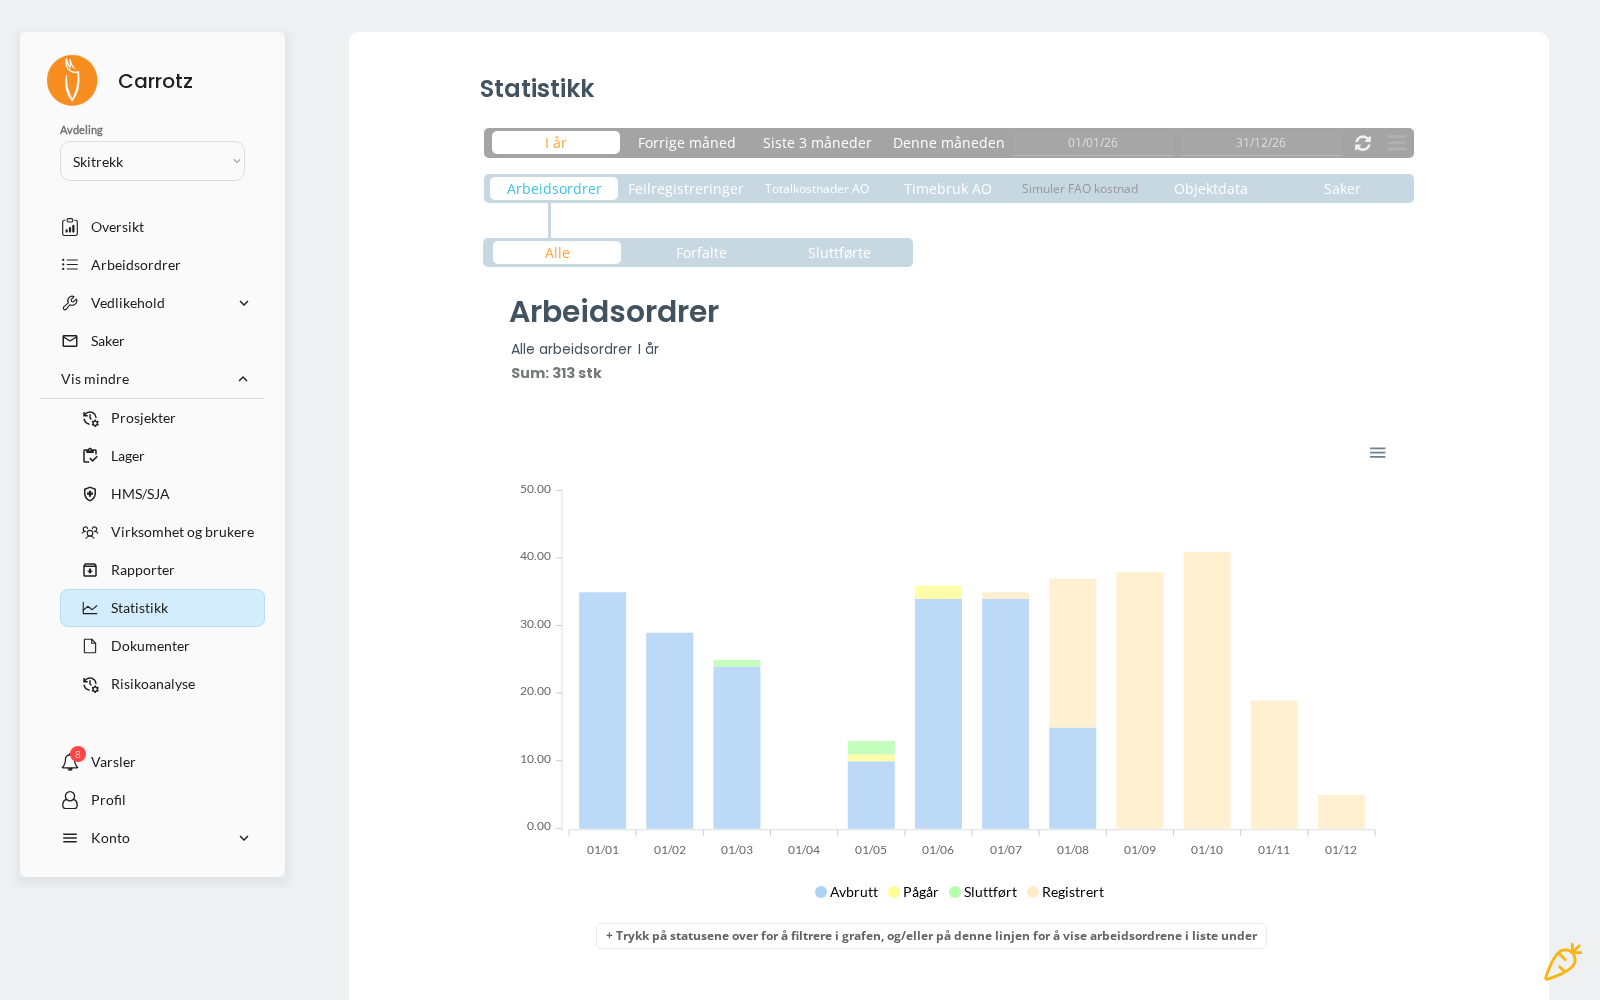
The statistics show, among other things:
- Work orders — count, status, completion rate
- Fault registrations — where the deviations arise
- Costs
- Hours spent
- Objects
- Cases
From history to insight#
The point of the statistics isn’t the numbers themselves, but the questions they let you ask:
| What you see | The question it raises |
|---|---|
| Many deviations on the same object | Should it be replaced rather than repaired? |
| Many overdue work orders | Are the intervals too tight, or is capacity too low? |
| High hours on one type of job | Can it be standardised or simplified? |
| Deviations that recur | Should the checklist or instruction be updated? |
| Objects with no recorded work | Are they forgotten, or not in use? |
Use the data to spot trends and improve maintenance — that is what separates a maintenance system from a registration system.
The statistics are only as good as the records. If fields are left out or work is documented imprecisely in the field, the numbers mislead. That is the most important reason why good practice in the field matters all the way up to management level.